Goals
In this project, you will make a calculator that determines the Air Quality Index (AQI) from sensor data, following methods published by the US Environmental Protection Agency (EPA).
You will be practicing the following concepts from prior labs:
- lists and 2D lists
- min/max/avg calculations with lists
- writing functions from specifications
- writing new functions and their docstrings
Summary
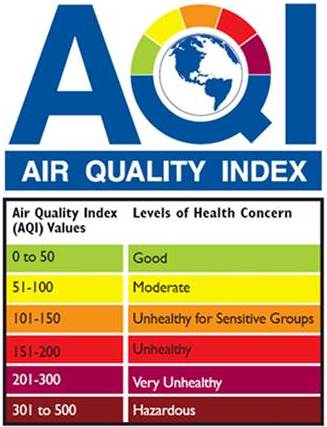
The Air Quality Index (AQI) is a simple, unitless index used to communicate air pollution to the general public. EPA's AirNow website shows interactive maps with the current AQI, as well as AQI forecasts.
To calculate the AQI, the US EPA draws from various environmental monitors that each record a pollutant. Six pollutant types are used to calculate the AQI:
- PM2.5
- Fine particulate matter with 2.5 micrometer diameter or smaller; examples include ash, smoke and smog.
- PM10
- Coarse particulate matter with 10--2.5 micrometer diameter; examples include dust, pollen and mold.
- NO2
- Nitrogen dioxide
- SO2
- Sulphur dioxide
- CO
- Carbon monoxide
- O3
- Ozone
You will write a calculator that prompts the user for sensor data from multiple locations, calculates the AQI for each location, and then reports some summary statistics about these locations.
Part of this project is an exercise in having control over functions and patterns to produce target outputs. It is not a creative exercise, but rather the opportunity for you to demonstrate precision, control and being detail-oriented. You are asked to demonstrate the requested behavior and output, matching the sample output exactly. Some functions must be implemented as specified, and some functions you will create and document yourself. In all samples below, user input is shown in italics and underlined.
Due Dates
- Checkpoint A: Due as a demo in any lab, drop-in tutoring or workshop before Thursday, May 2 at 7 PM.
- Final Code: Due via Moodle on Thursday, May 9 at 11:55 PM.
Template
You will need the template for the project:
- Download the template, template_P3.py
Calculation Details
To write your calculator, you will need to understand the formula and data used by the EPA to calculate AQI. You will need to refer to the below AQI Equation and AQI Breakpoint Table for constants and logic to write your program.
AQI Equation
For each pollutant P, the sensor gives a concentration reading CP. This reading is typicaly an average over some period of time. The index for that pollutant is given by the following equation:
IP = (Ihigh - Ilow) / (Chigh - Clow) * (CP - Clow) + Ilow
These variables are the following:
- CP
- The concentration of pollutant P.
- Clow, Chigh
- The low/high concentration breakpoints that contain CP. These breakpoints are defined by the EPA in the Breakpoint Table (below).
- Ilow, Ihigh
- The low/high index range associated with concentration breakpoints for CP.
- PM2.5: truncate to 1 decimal place (µg/m3)
- PM10: truncate to integer (µg/m3)
- NO2: truncate to integer (ppb)
- SO2: truncate to integer (ppb)
- CO: truncate to 1 decimal place (ppm)
- O3: truncate to integer (ppb)
After we have the index for each pollutant, the AQI is simply the maximum index across all pollutants.
Per EPA guidance, you should truncate all sensor values before calculation in the following way:
AQI Breakpoint Table
Category |
AQI |
PM2.5 (µg/m3) 24hr avg |
PM10 (µg/m3) 24hr avg |
NO2 (ppb) 1hr avg |
SO2 (ppb) 1hr avg |
CO (ppm) 8hr avg |
O3 (ppb) 8hr avg |
O3 (ppb) 1hr avg |
|---|---|---|---|---|---|---|---|---|
| Good | 0--50 | 0--12.0 | 0--54 | 0--53 | 0--35 | 0--4.4 | 0--54 | - |
| Moderate | 51--100 | 12.1--35.4 | 55--154 | 54--100 | 36--75 | 4.5--9.4 | 55--70 | - |
| Unhealthy for Sensitive Groups |
101--150 | 35.5--55.4 | 155--254 | 101--360 | 76--185 | 9.5--12.4 | 71--85 | 125--164 |
| Unhealthy | 151--200 | 55.5--150.4 | 255--354 | 361--649 | 186--304 | 12.5--15.4 | 86--105 | 165--204 |
| Very Unhealthy | 201--300 | 150.5--250.4 | 355--424 | 650--1249 | 305--604 | 15.5--30.4 | 106--200 | 205--404 |
| Hazardous | 301--500 | 250.5--500.4 | 425--604 | 1250--2049 | 605--1004 | 30.5--50.4 | - | 405--604 |
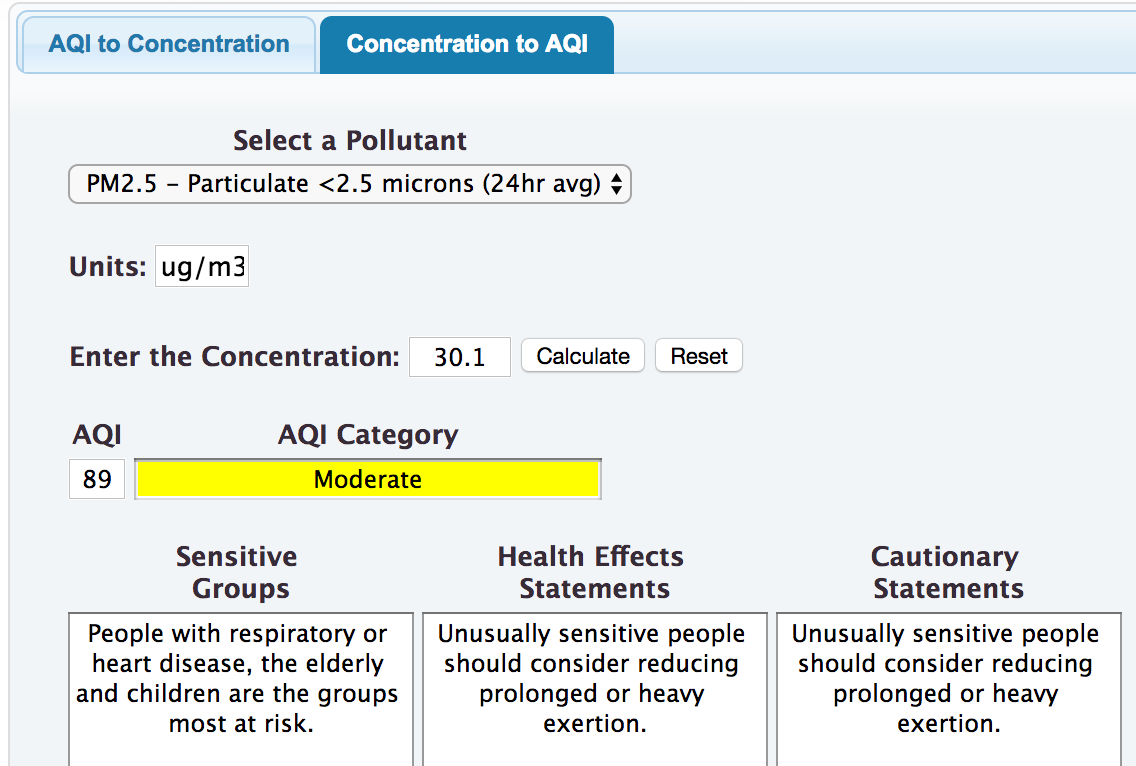
Example: AQI Calculation
IPM-2.5 = (Ihigh - Ilow) / (Chigh - Clow) * (CP - Clow) + Ilow
IPM-2.5 = (100 - 51) / (35.4 - 12.1) * (30.1 - 12.1) + 51 = 88.85 = 89
We can check this calculation using the EPA's AQI calculator:
Checkpoint A
Running the unmodified template demonstrates the following input/output behavior:
=== Air Quality Index (AQI) Calculator ===

Enter name of ** Location **: A
	 [None, None, None, None, None, None, None]
	 [-1, -1, -1, -1, -1, -1, -1]
['A']
[-1]
[None]

Enter name of ** Location **: B
	 [None, None, None, None, None, None, None]
	 [-1, -1, -1, -1, -1, -1, -1]
['A', 'B']
[-1, -1]
[None, None]

Enter name of ** Location **:
This will be the "skeleton" of the program that will give us insight into the values and calculations for the demo of Part A. This is not the final behavior of the calculator, but will exposure the way you've ingested the monitor data and transformed it, and how you've calculated the per-pollutant index.
For Checkpoint A, you will need to modify the template to demonstrate a program that satisfies the following:
- The functions
get_concentration()andget_per_pollutant_index()are fully implemented as specified. - The program matches the sample input/output below. For monitor readings, assume users enter integers and floats of arbitrary precision (which must be modified to meet the EPA rounding guidance). If a monitor is not present or had no reading, the use will enter a -1.
- Demo. Demo Checkpoint A.
Sample Input/Output
- Sample 1
=== Air Quality Index (AQI) Calculator ===

Enter name of ** Location **: Cupertino
    -> PM-2.5 [ug/m3, 24-hr avg]: 12.3
    -> PM-10 [ug/m3, 24-hr avg]: 0.1
    -> NO2 [ppb, 1-hr avg]: 0.5
    -> SO2 [ppb, 1-hr avg]: 11
    -> CO [ppm, 8-hr avg]: 12
    -> O3 [ppb, 8-hr avg]: 110
    -> O3 [ppb, 1-hr avg]: 170
	 [12.3, 0, 0, 11, 12.0, 110, 170]
	 [51, 0, 0, 16, 143, 205, 157]
['Cupertino']
[205]
[12.3]

Enter name of ** Location **: Davis
    -> PM-2.5 [ug/m3, 24-hr avg]: 130
    -> PM-10 [ug/m3, 24-hr avg]: 25.33
    -> NO2 [ppb, 1-hr avg]: 5.4
    -> SO2 [ppb, 1-hr avg]: 0
    -> CO [ppm, 8-hr avg]: 1.4
    -> O3 [ppb, 8-hr avg]: 69
    -> O3 [ppb, 1-hr avg]: 100
	 [130.0, 25, 5, 0, 1.4, 69, 100]
	 [189, 23, 5, 0, 16, 97, -1]
['Cupertino', 'Davis']
[205, 189]
[12.3, 130.0]

Enter name of ** Location **: Woodland
    -> PM-2.5 [ug/m3, 24-hr avg]: 20
    -> PM-10 [ug/m3, 24-hr avg]: 10
    -> NO2 [ppb, 1-hr avg]: 40
    -> SO2 [ppb, 1-hr avg]: 15
    -> CO [ppm, 8-hr avg]: 1.4
    -> O3 [ppb, 8-hr avg]: 10
    -> O3 [ppb, 1-hr avg]: 123
	 [20.0, 10, 40, 15, 1.4, 10, 123]
	 [68, 9, 38, 21, 16, 9, -1]
['Cupertino', 'Davis', 'Woodland']
[205, 189, 68]
[12.3, 130.0, 20.0]

Enter name of ** Location **: Vacaville
    -> PM-2.5 [ug/m3, 24-hr avg]: 10
    -> PM-10 [ug/m3, 24-hr avg]: 2
    -> NO2 [ppb, 1-hr avg]: 10
    -> SO2 [ppb, 1-hr avg]: 5
    -> CO [ppm, 8-hr avg]: 2.4
    -> O3 [ppb, 8-hr avg]: 8
    -> O3 [ppb, 1-hr avg]: 165
	 [10.0, 2, 10, 5, 2.4, 8, 165]
	 [42, 2, 9, 7, 27, 7, 151]
['Cupertino', 'Davis', 'Woodland', 'Vacaville']
[205, 189, 68, 151]
[12.3, 130.0, 20.0, 10.0]

Enter name of ** Location **: Santa Cruz
    -> PM-2.5 [ug/m3, 24-hr avg]: 5
    -> PM-10 [ug/m3, 24-hr avg]: 12.5
    -> NO2 [ppb, 1-hr avg]: 20.8
    -> SO2 [ppb, 1-hr avg]: 4
    -> CO [ppm, 8-hr avg]: 1.1
    -> O3 [ppb, 8-hr avg]: -1
    -> O3 [ppb, 1-hr avg]: -1
	 [5.0, 12, 20, 4, 1.1, -1, -1]
	 [21, 11, 19, 6, 12, -1, -1]
['Cupertino', 'Davis', 'Woodland', 'Vacaville', 'Santa Cruz']
[205, 189, 68, 151, 21]
[12.3, 130.0, 20.0, 10.0, 5.0]

Enter name of ** Location **: Watsonville
    -> PM-2.5 [ug/m3, 24-hr avg]: 12
    -> PM-10 [ug/m3, 24-hr avg]: -1
    -> NO2 [ppb, 1-hr avg]: -1
    -> SO2 [ppb, 1-hr avg]: -1
    -> CO [ppm, 8-hr avg]: -1
    -> O3 [ppb, 8-hr avg]: -1
    -> O3 [ppb, 1-hr avg]: -1
	 [12.0, -1, -1, -1, -1, -1, -1]
	 [50, -1, -1, -1, -1, -1, -1]
['Cupertino', 'Davis', 'Woodland', 'Vacaville', 'Santa Cruz', 'Watsonville']
[205, 189, 68, 151, 21, 50]
[12.3, 130.0, 20.0, 10.0, 5.0, 12.0]

Enter name of ** Location **: Salinas
    -> PM-2.5 [ug/m3, 24-hr avg]: -1
    -> PM-10 [ug/m3, 24-hr avg]: -1
    -> NO2 [ppb, 1-hr avg]: 55
    -> SO2 [ppb, 1-hr avg]: -1
    -> CO [ppm, 8-hr avg]: 3.0
    -> O3 [ppb, 8-hr avg]: 56
    -> O3 [ppb, 1-hr avg]: -1
	 [-1, -1, 55, -1, 3.0, 56, -1]
	 [-1, -1, 52, -1, 34, 54, -1]
['Cupertino', 'Davis', 'Woodland', 'Vacaville', 'Santa Cruz', 'Watsonville', 'Salinas']
[205, 189, 68, 151, 21, 50, 54]
[12.3, 130.0, 20.0, 10.0, 5.0, 12.0]

Enter name of ** Location **:
Advice and Hints
Warning: You must implement the functions as specified. Functions should not print anything, unless it is specified.
Final Code
In your final code, you will extend the prior code to print summary statistics and match the below input/output behavior. In particular:
- You will create any missing printed output by writing new functions and adding appropriate calls to these in
main(). The functionsget_per_pollutant_index()andget_concentration()still should not print anything. - You should implement a function to produce the "per-pollutant concentration" statements and document its behavior using a docstring that follows our class docstring conventions (there is a TODO for this in the template).
- You should implement a function to produce the "Summary Report" and document its behavior using a docstring that follows our class docstring conventions (there is a TODO for this in the template).
- All printed output should be formatted as shown in the samples below.
- You should remove extraneous printed output to match the provided samples.
There is no demo for your final code.
Advice and Hints
Hint: Be careful about computing the average PM-2.5 concentations across locations, in the scenario that the user did not have a PM-2.5 reading at some locations. For example, in Sample 3, the average PM-2.5 value is 8.5 ug/m3, which is just the average of Santa Cruz's and Watsonville's two readings.
Warning: Do not ignore the TODOs requesting that you write functions to produce the sample output.
=== Air Quality Index (AQI) Calculator ===

Enter name of ** Location **: Newport Beach
    -> PM-2.5 [ug/m3, 24-hr avg]: -1
    -> PM-10 [ug/m3, 24-hr avg]: 40.1
       PM-10 concentration 40 yields 37 index
    -> NO2 [ppb, 1-hr avg]: 25
       NO2 concentration 25 yields 24 index
    -> SO2 [ppb, 1-hr avg]: -1
    -> CO [ppm, 8-hr avg]: 12
       CO concentration 12.0 yields 143 index
    -> O3 [ppb, 8-hr avg]: 302
    -> O3 [ppb, 1-hr avg]: 126
       O3 concentration 126 yields 102 index
    AQI for Newport Beach is 143
    Condition: Unhealthy for Sensitive Groups

Enter name of ** Location **:

Summary Report
    Location with max AQI is Newport Beach (143)
    Location with min AQI is Newport Beach (143)
    Avg PM-2.5 concentration reading: No Data
=== Air Quality Index (AQI) Calculator ===

Enter name of ** Location **: Santa Cruz
    -> PM-2.5 [ug/m3, 24-hr avg]: 5
       PM-2.5 concentration 5.0 yields 21 index
    -> PM-10 [ug/m3, 24-hr avg]: 12.5
       PM-10 concentration 12 yields 11 index
    -> NO2 [ppb, 1-hr avg]: 20.8
       NO2 concentration 20 yields 19 index
    -> SO2 [ppb, 1-hr avg]: 4
       SO2 concentration 4 yields 6 index
    -> CO [ppm, 8-hr avg]: 1.1
       CO concentration 1.1 yields 12 index
    -> O3 [ppb, 8-hr avg]: -1
    -> O3 [ppb, 1-hr avg]: -1
    AQI for Santa Cruz is 21
    Condition: Good

Enter name of ** Location **: Watsonville
    -> PM-2.5 [ug/m3, 24-hr avg]: 12
       PM-2.5 concentration 12.0 yields 50 index
    -> PM-10 [ug/m3, 24-hr avg]: -1
    -> NO2 [ppb, 1-hr avg]: -1
    -> SO2 [ppb, 1-hr avg]: -1
    -> CO [ppm, 8-hr avg]: -1
    -> O3 [ppb, 8-hr avg]: -1
    -> O3 [ppb, 1-hr avg]: -1
    AQI for Watsonville is 50
    Condition: Good

Enter name of ** Location **: Salinas
    -> PM-2.5 [ug/m3, 24-hr avg]: -1
    -> PM-10 [ug/m3, 24-hr avg]: -1
    -> NO2 [ppb, 1-hr avg]: 55
       NO2 concentration 55 yields 52 index
    -> SO2 [ppb, 1-hr avg]: -1
    -> CO [ppm, 8-hr avg]: 3.0
       CO concentration 3.0 yields 34 index
    -> O3 [ppb, 8-hr avg]: 56
    -> O3 [ppb, 1-hr avg]: -1
       O3 concentration 56 yields 54 index
    AQI for Salinas is 54
    Condition: Moderate

Enter name of ** Location **:

Summary Report
    Location with max AQI is Salinas (54)
    Location with min AQI is Santa Cruz (21)
    Avg PM-2.5 concentration reading: 8.5
=== Air Quality Index (AQI) Calculator ===

Enter name of ** Location **: Cupertino
    -> PM-2.5 [ug/m3, 24-hr avg]: 12.3
       PM-2.5 concentration 12.3 yields 51 index
    -> PM-10 [ug/m3, 24-hr avg]: 0.1
       PM-10 concentration 0 yields 0 index
    -> NO2 [ppb, 1-hr avg]: 0.5
       NO2 concentration 0 yields 0 index
    -> SO2 [ppb, 1-hr avg]: 11
       SO2 concentration 11 yields 16 index
    -> CO [ppm, 8-hr avg]: 12
       CO concentration 12.0 yields 143 index
    -> O3 [ppb, 8-hr avg]: 110
    -> O3 [ppb, 1-hr avg]: 170
       O3 concentration 110 yields 205 index
    AQI for Cupertino is 205
    Condition: Very Unhealthy

Enter name of ** Location **: Davis
    -> PM-2.5 [ug/m3, 24-hr avg]: 130
       PM-2.5 concentration 130.0 yields 189 index
    -> PM-10 [ug/m3, 24-hr avg]: 25.33
       PM-10 concentration 25 yields 23 index
    -> NO2 [ppb, 1-hr avg]: 5.4
       NO2 concentration 5 yields 5 index
    -> SO2 [ppb, 1-hr avg]: 0
       SO2 concentration 0 yields 0 index
    -> CO [ppm, 8-hr avg]: 1.4
       CO concentration 1.4 yields 16 index
    -> O3 [ppb, 8-hr avg]: 69
    -> O3 [ppb, 1-hr avg]: 100
       O3 concentration 69 yields 97 index
    AQI for Davis is 189
    Condition: Unhealthy

Enter name of ** Location **: Woodland
    -> PM-2.5 [ug/m3, 24-hr avg]: 20
       PM-2.5 concentration 20.0 yields 68 index
    -> PM-10 [ug/m3, 24-hr avg]: 10
       PM-10 concentration 10 yields 9 index
    -> NO2 [ppb, 1-hr avg]: 40
       NO2 concentration 40 yields 38 index
    -> SO2 [ppb, 1-hr avg]: 15
       SO2 concentration 15 yields 21 index
    -> CO [ppm, 8-hr avg]: 1.4
       CO concentration 1.4 yields 16 index
    -> O3 [ppb, 8-hr avg]: 10
    -> O3 [ppb, 1-hr avg]: 123
       O3 concentration 10 yields 9 index
    AQI for Woodland is 68
    Condition: Moderate

Enter name of ** Location **: Vacaville
    -> PM-2.5 [ug/m3, 24-hr avg]: 10
       PM-2.5 concentration 10.0 yields 42 index
    -> PM-10 [ug/m3, 24-hr avg]: 2
       PM-10 concentration 2 yields 2 index
    -> NO2 [ppb, 1-hr avg]: 10
       NO2 concentration 10 yields 9 index
    -> SO2 [ppb, 1-hr avg]: 5
       SO2 concentration 5 yields 7 index
    -> CO [ppm, 8-hr avg]: 2.4
       CO concentration 2.4 yields 27 index
    -> O3 [ppb, 8-hr avg]: 8
    -> O3 [ppb, 1-hr avg]: 165
       O3 concentration 165 yields 151 index
    AQI for Vacaville is 151
    Condition: Unhealthy

Enter name of ** Location **: Santa Cruz
    -> PM-2.5 [ug/m3, 24-hr avg]: 5
       PM-2.5 concentration 5.0 yields 21 index
    -> PM-10 [ug/m3, 24-hr avg]: 12.5
       PM-10 concentration 12 yields 11 index
    -> NO2 [ppb, 1-hr avg]: 20.8
       NO2 concentration 20 yields 19 index
    -> SO2 [ppb, 1-hr avg]: 4
       SO2 concentration 4 yields 6 index
    -> CO [ppm, 8-hr avg]: 1.1
       CO concentration 1.1 yields 12 index
    -> O3 [ppb, 8-hr avg]: -1
    -> O3 [ppb, 1-hr avg]: -1
    AQI for Santa Cruz is 21
    Condition: Good

Enter name of ** Location **: Watsonville
    -> PM-2.5 [ug/m3, 24-hr avg]: 12
       PM-2.5 concentration 12.0 yields 50 index
    -> PM-10 [ug/m3, 24-hr avg]: -1
    -> NO2 [ppb, 1-hr avg]: -1
    -> SO2 [ppb, 1-hr avg]: -1
    -> CO [ppm, 8-hr avg]: -1
    -> O3 [ppb, 8-hr avg]: -1
    -> O3 [ppb, 1-hr avg]: -1
    AQI for Watsonville is 50
    Condition: Good

Enter name of ** Location **: Salinas
    -> PM-2.5 [ug/m3, 24-hr avg]: -1
    -> PM-10 [ug/m3, 24-hr avg]: -1
    -> NO2 [ppb, 1-hr avg]: 55
       NO2 concentration 55 yields 52 index
    -> SO2 [ppb, 1-hr avg]: -1
    -> CO [ppm, 8-hr avg]: 3.0
       CO concentration 3.0 yields 34 index
    -> O3 [ppb, 8-hr avg]: 56
    -> O3 [ppb, 1-hr avg]: -1
       O3 concentration 56 yields 54 index
    AQI for Salinas is 54
    Condition: Moderate

Enter name of ** Location **:

Summary Report
    Location with max AQI is Cupertino (205)
    Location with min AQI is Santa Cruz (21)
    Avg PM-2.5 concentration reading: 31.5
Grading Rubric
- Checkpoints [10%]
-
The checkpoint demo is worth 10 points (all or nothing).
- Programming Design and Style [35%]
-
In addition to being correct, your program should be easy to understand and well documented. For details, see the rubric below.
- Correctness [55%]
-
Your program will be tested numerous times, using different inputs, to be sure that it meets the specification. You will not get full credit for this unless your output matches the sample output exactly for every case, including capitalization and spacing. For details, see the rubric below.
Detailed Rubric
Correctness: functionality and specifications (50 points -- 5 points each)
| Feature 1: | For each AQI, a correct and matching "Condition:" message is reported (Ex: Samples 1, 2, 3 and 4). There are six possible condition messages (see the AQI Breakpoint Table for the Category labels). |
| Feature 2: | The locations with the max and min AQI are correctly reported in the Summary Report (Ex: Samples 3, 4 and 7). |
| Feature 3: | The average PM-2.5 concentration is correctly reported in the Summary Report. This should work for these scenarios: for 1 location (Ex: Sample 2); for multiple locations (Ex: Sample 4); when some locations are missing PM-2.5 measurements (Ex: Sample 3). |
| Feature 4: | Given a concentration for PM-2.5 and PM-10, the per-pollutant (IPM-2.5 and IPM-10) index is correctly computed, including: the truncation of the concentration data is performed correctly, all boundary break-points are correctly reasoned, and the index formula is correctly computed. |
| Feature 5: | Given concentrations for NO2, SO2 and CO, their per-pollutant indices are correctly computed, including: the truncation of the concentration data is performed correctly, all boundary break-points are correctly reasoned, and the index formula is correctly computed. |
| Feature 6: | Given a concentration for O3, the per-pollutant (IO3) index is correctly computed, including: the truncation of the concentration data is performed correctly, all boundary break-points are correctly reasoned, and the index formula is correctly computed. |
| Feature 7: | Given all per-pollutant indices (PM-2.5, PM-10, NO2, SO2, CO, and O3), the location's AQI is correctly computed (Ex: Samples 3 and 4). |
| Feature 8: | Given some per-pollutant indices (PM-2.5, PM-10, NO2, SO2, CO, and O3, where one or more readings are missing from the user's input), the location's AQI is correctly computed (Ex: Sample 7). |
| Feature 9: |
The behavior of the get_concentration() and get_per_pollutant_index() functions match theior specifications and do not duplicate code. If there are lines of code that have been repeatedly copy-pasted, consider re-writting the function's logic.
|
| Feature 10: |
The per-pollutant concentration is printed by a sensible function that is correctly documented. The Summary Report is printed using a sensible function that is correctly documented. Each should be used where the template had originally noted a TODO including write a new function.
|
Correctness: spacing, newlines, output decorations, etc (5 points)
All or nothing: all spacing, newlines, text decorations ('->', etc) and printed output match the sample output. You can check yours by using an online diff tool to compare
Programming Design and Style (30 points)
- Docstring (5 points)
- There should be a docstring at the top of your submitted file with the following information:
1 pt. Your name (first and last) 1 pt. The course (CS 115) 1 pt. The assignment (e.g., Project 1) 2 pts. A brief description of what the program does - Documentation (6 points)
- Not counting the docstring, your program should contain at least three comments explaining aspects of your code that are potentially tricky for a person reading it to understand. You should assume that the person understands what Python syntax means but may not understand why you are doing what you are doing.
6 pts. You have at least 3 useful comments (2 points each) - Variables (5 points)
-
5 pts. Variables have helpful names that indicate what kind of information they contain. - Algorithm (4 points)
-
2 pts. Your algorithm is straightforward and easy to follow. 2 pts. Your algorithm is reasonably efficient, with no wasted computation or unused variables. - Dead code or misleading comments (5 points)
-
3 pts. Your final program should not contain dead code. Dead code is any old code that has been commented-out or otherwise been made permanently inactive, i.e., for the purposes of development or testing. 2 pts. Your program should not have irrelevant or misleading comments. This includes #TODOcomments that do not indicate things that still need to be done; if they been done then they should no longer be marked "TODO". This also includes comments you have added to the code or inherited from the template that do not describe the code any longer. - Program structure (5 points)
- All or nothing: your code should define a main function and then call that function, just like our programs do in the lab. Other than library imports, the docstring, and the final call to
main(), you should not have any stray code outside a function definition. - Catchall
- For students using language features that were not covered in class, up to 5 points may be taken off if the principles of programming style are not adhered to when using these features. If you have any questions about what this means, then ask.
Submission
You should submit your final code on Moodle by the deadline. I strongly encourage you to take precautions to make and manage backups while you work on your project, in case something goes wrong either while working or with your submission to Moodle.
Name the file you submit to Moodle yourlastnameP3.py, substituting your actual last name (in lowercase) for yourlastname.
Late Policies
Project late policies are outlined in the course policies page.
Collaboration Policy
Programming projects must be your own work, and academic misconduct is taken very seriously. You may discuss ideas and approaches with other students and the course staff, but you should work out all details and write up all solutions on your own. The following actions will be penalized as academic dishonesty:
- Copying part or all of another student's assignment
- Copying old or published solutions
- Looking at another student's code or discussing it in great detail. You will be penalized if your program matches another student's program too closely.
- Showing your code or describing your code in great detail to anyone other than the course staff or tutor.